A view is a way to see selected information from multiple records at once, with the information organized in a structured and repeatable way. A normal view, or just a ‘view’, looks like a table or list that displays selected data from application records, usually in a predefined sorted order. Your email inbox is an example of a view, and it is also visually like a spreadsheet with sorted columns. There are also Calendar Views, which can show records with date and time fields in a range of calendar formats, and also Kanban Views that display record information in a Kanban card format.
Sorted Views
A sorted view is simply a view that has been sorted: Its records are organized into a defined order based on their data. It’s very similar to sorting columns in a spreadsheet.
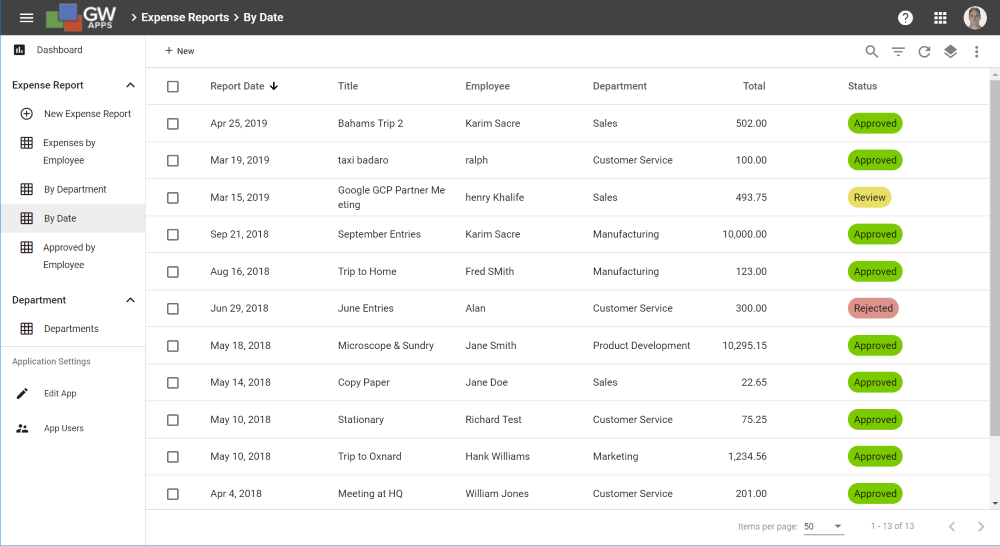
In the example below, expense report records are sorted by their Report Date in descending order (newest expense reports first).
| Sorted View Example |
 |
Grouped Views
Grouping is an additional way records can be organized in views. With grouping, instead of just sorting records by a specific field value, such as department, all the records that have the same department name are grouped together and displayed under a heading of that department name.
In the example below, expense report records are grouped by department and then employee name, and finally sorted by their Report Date in descending order (newest expense reports first). As you can see there are a set of blue headings that give the department names (Customer Service, Manufacturing, Marketing, etc). The Manufacturing department’s group has been expanded (by clicking on it), and there are a set of yellow headings that give the employee names of those who are in the Manufacturing department (Dan Smith, Fred Smith, etc). Finally the Dan Smith employee group has been expanded to show all the expense report records that Dan Smith has, sorted by the report date.
| Grouped View Example |
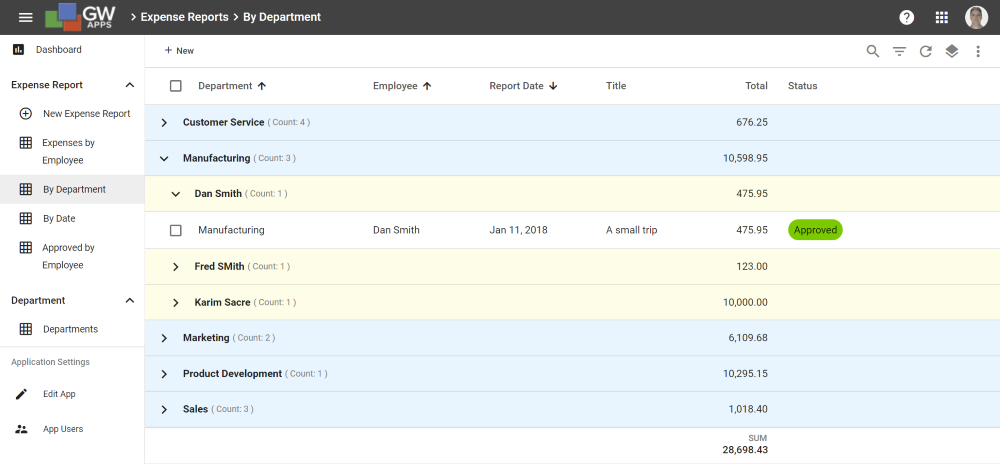 |
There is an additional function that the grouping can perform: As well as helping to organize the expense reports, or whatever the view is showing, if there are any numeric columns, the grouping can show the sum, average, minimum or maximum value for each grouping and for the view as a whole. In the example above, it is showing the expense report totals summed by the department and employee groupings, and also the total for all the expense reports in the view.
Calendar Views
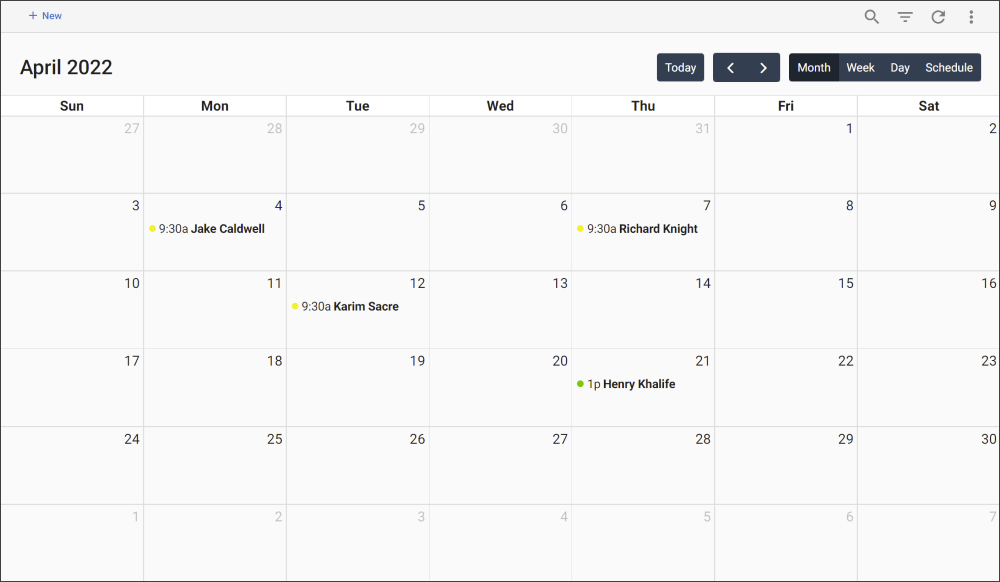
A calendar view lets you see data from records that contain a date and a time field, in one of several calendar formats: Daily, weekly and Monthly. Additional field data can also be displayed, such as the users name in the example below.
| Month Calendar View Example |
 |
Kanban Views
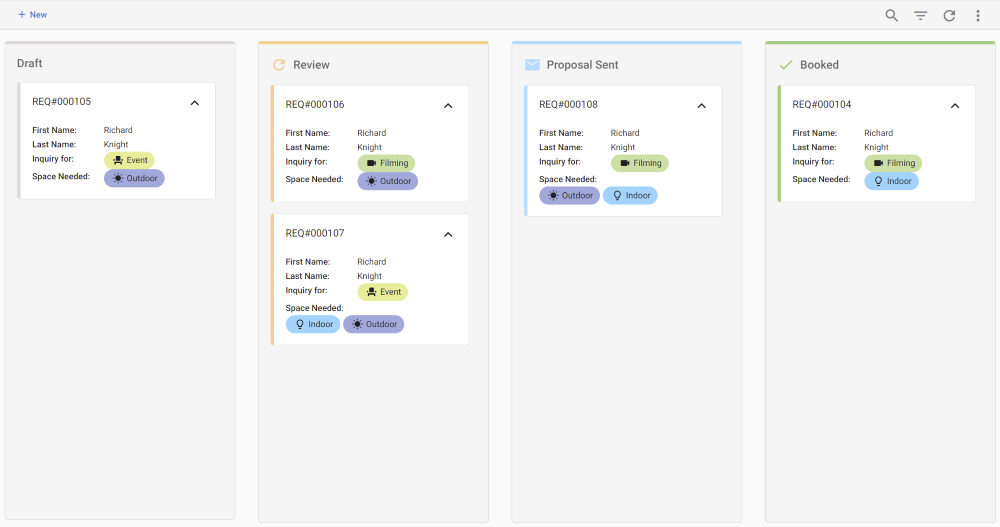
A Kanban view is useful for organizing complex events or projects, as you can move items/tasks between workflow stages by simply dragging and dropping their cards in the Kanban view. Each Kanban card can have whatever field information you need, though keeping the information concise is recommended or the cards become too large and you won’t see enough of them to work efficiently. (See this article at Forbes for an overview of Kanban.)
| Kanban View Example |
 |
Next Steps
| Below are links to articles that cover how to manage an applications views and create new view: |
| Views: Dashboard & Creating Views |
| Below is the link to the views part of the Building an Expense Reports App tutorial series: |
| Part 7 – Views |