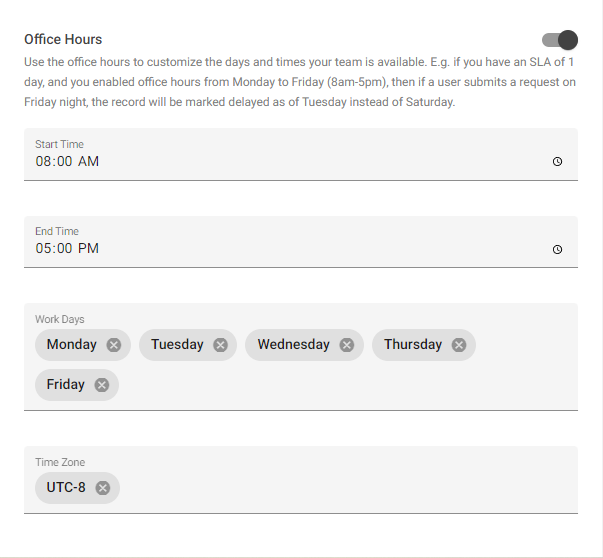
The SLA feature allows you to configure required response times for the workflow stages, so that you can help enforce desired service levels for the process managed by an app. You define the start and end points for a stage and the required response time. If a request is not completed within the specified time, it is considered delayed. It is possible to have GW Apps send an email or in-app notification whenever a record is marked as delayed for a workflow stage, so a manager could take action immediately. (You would need a Trigger and then either an Email Template or a Notification Action to do this.)
Creating & Managing SLAs
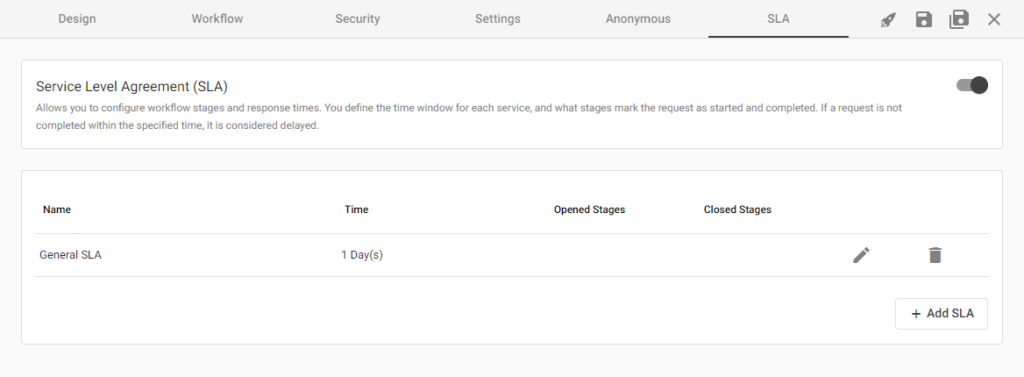
To enable SLAs on your form, open the form in edit mode and navigate to the SLA tab on the header bar. Click on the SLA activation toggle at the top right of the page. After turning on SLAs, you will see a new box appear below with a ‘General SLA’ already created, but not yet configured. (See Configuring SLAs later in this article for details.)
Note that since SLAs are defined in relation tor specific starting and ending workflow stages, you must first create the required workflow stages before creating the SLAs.
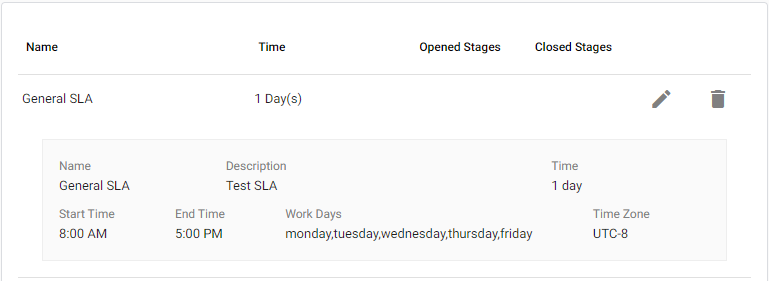
Clicking on an SLA row will display details about it in a drop-down panel (see image below). Additionally, to remove an SLA click the trashcan icon on the far right end of the SLA row.
Adding SLAs
To add additional SLAs, simply click the ‘+ Add SLA‘ button in the bottom right corner of the page. A new SLA will be added to the bottom of the list. All new SLAs are named ‘General SLA’. The right-side SLA Properties panel will also open, allowing you to configure the new SLA.
Configuring SLAs
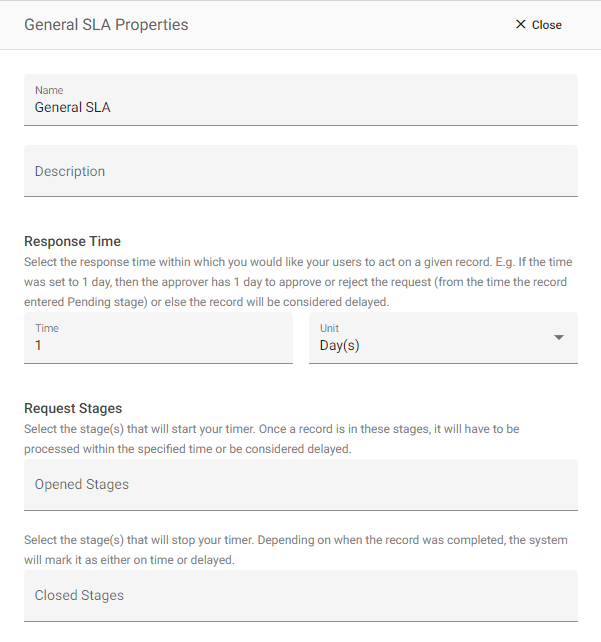
As already mentioned, the properties panel will automatically open when you add a new SLA. To access the properties panel otherwise, simply click the pencil icon on the right end of the SLA row you wish to configure.
The properties are well documented within the platform, as you can see in the images below. Be sure to give your SLAs a descriptive name so they’re easy to identify. A good practice is to name it the same as the workflow stage name that the SLA covers. If the SLA covers more than one workflow stage, try to give it meaningful name, such as Approval Stages, Delivery Stages, or Overall SLA. The description is only visible in while editing the SLAs, and will not display to users seeing the SLA performance metrics.
Viewing & Tracking SLAs
There are currently four ways to view the performance metrics for an app’s SLAs. Within your application you can use the SLA widget on a Page, the SLA fields in views to add SAL data to any view, and the SLA component on a Form to display the SLA data for only the current record. The final one is on the Reporting page, however this option is only available to platform Super Admins. Additionally, you can trigger actions on record delays, e.g., send an email and/or in-app notification when a record is delayed.
- SLA Widget on a Page: To view you SLA performance metrics in-app, you’ll need to create a page and add the SLA Widget to it. Here’s some documentation on how to create Pages in your apps: Creating Pages, and Page Editor Overview.
- SLA Fields in Views: For any form where SLAs have been defined, SLA data fields will be available in the left side palette of fields on the Table Columns tab of the view editor. Each defined SLA will have a section in the palette with 8 data values specific to that SLA. Yu can drag any of these SLA fields into you view to display that data in the view.
- SLA Component on a Form: To display SLA data for the current record as part of the form, drag the SLA component from the left side palette and drop it in the desired location on the form. Learn more here: SLA Component.
- Reporting Page SLA Stats: SLA performance metrics from all your applications can be viewed on the Reporting page ‘SLA Stats’ section. This feature section is only available to platform Super Admins at the moment. Learn more here: Reporting Overview.
- Delayed SLA Trigger: You can create custom actions that automatically trigger when a record has a delayed SLA. For example, you can send an email notification. Learn more about Actions & Triggers here: Triggers, and Actions.
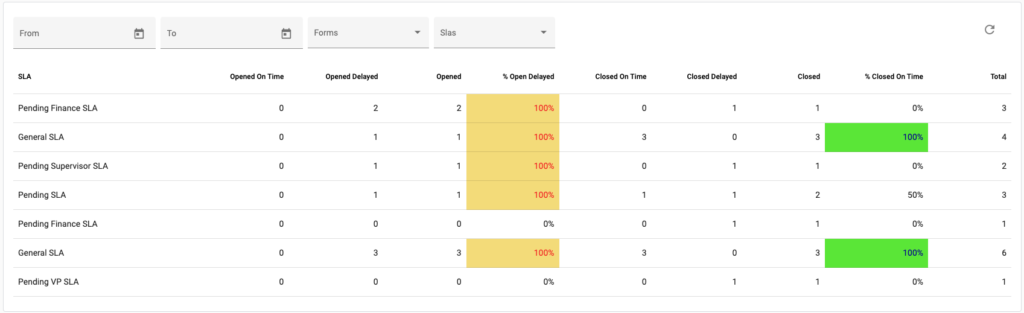
Interpreting the SLA Report
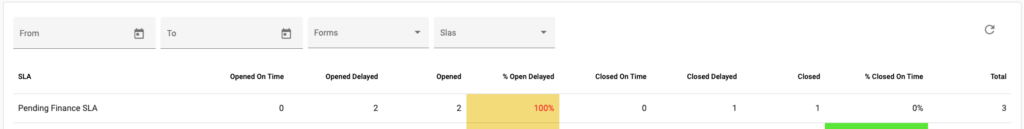
The image below shows the top of an SLA report, and the table that follows explains the meaning of each SLA performance metric:
| SLA Metric | Explanation |
|---|---|
| SLA | SLA name. |
| Opened On Time | # of records CURRENTLY at that stage and still within the SLA period. |
| Opened Delayed | # of records CURRENTLY at that stage and have already exceeded the SLA period. |
| Opened | # of records CURRENTLY at that stage. |
| % Open Delayed | Open Delayed / Opened, as a percentage. |
| Closed On Time | # of records that have completed this stage within the SLA period. |
| Closed Delayed | # of records that have completed this stage and exceeded the SLA period. |
| Closed | # of records that have completed this stage. |
| % Closed On Time | Closed On Time / Closed, as a percentage. |
| Average Time | The average time taken to process records through that SLA. Either actual hours elapsed or office hours elapsed, depending on if the office hours setting is enabled. |
| Total | Opened + Closed, for total records to have ever entered this stage. |